Ra’anan Gefen and Leonid Yanovitz, Nano-Retina Inc, CC BY-SA 4.0 <https://creativecommons.org/licenses/by-sa/4.0>, via Wikimedia Commons
Science of Chess - Eyetracking, board vision, and expertise (Part 1 of 2)
Looking for the best move involves, well...looking. How do players move their eyes during a game and what do they get out of it?
If you ask me who I think the greatest chess player of all time is, my answer may change a little depending on the day, my mood about recent wins and losses, and a host of other factors. If you ask me who the most quotable chess player of all time is, however, only one name comes to mind: Savielly Tartakower. The man was just a chess quote machine and a fair number of his best live rent-free in my head. Of these, one I think about a lot is his classic, "The blunders are all there on the board, waiting to be made." As a humble patzer, I'm all too aware of the wrong moves that lurk around every corner and I frequently don't make them wait long to find their day in the sun. Besides Tartakower's actual quotation, however, I also think a lot about a sort of corollary to this observation: Somewhere on the board in any given position is the best move I could make, also waiting for me to notice it. If only I could see it!
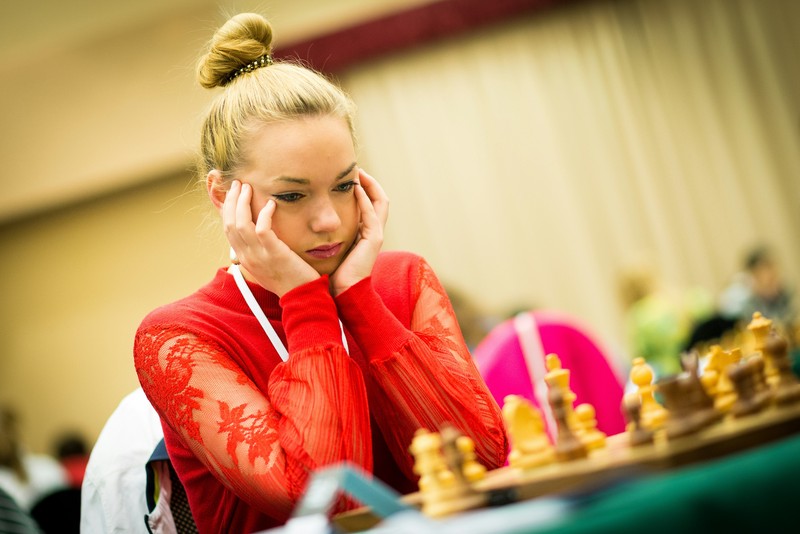
Whenever we look at a position, we are always staring at the worst possible move and the best possible move - but what do we actually see? Photo by Michal Vrba on Unsplash
Of course it isn't just about seeing a move. I've had a few conversations lately with folks who have read some of these posts and been frustrated by the emphasis on pattern recognition both in chess research and some approaches to coaching. To be fair, they have a point: Even if I can see that a move is a possibility, I also need to understand what follows from it, too. Patterns are only worth so much if they aren't part of a plan. That deeper understanding depends on a lot more than just recognizing a configuration of pieces somewhere on the board. Still, given that I'm both a vision scientist and a player who misses my own good moves (and my opponents') the act of seeing the board is something I'm very interested in. Why is it so easy to miss good moves? How is it possible for even strong players to miss obvious threats when they're right there on the board? To put it another way - how do we look at the chessboard and why does the act of looking sometimes still mean we don't see what we need to see?
In this blog post and a sequel to come, I'll talk about some interesting results from two different, but closely related, studies that use similar approaches to investigate how players of varying strength look at the chess board. A thread that connects them is the use of eyetracking - a methodology that has become increasingly popular over the years due to advances in both the accuracy and the accessibility of the necessary technology. I only use eyetracking a little bit in my own research, but I do think it's interesting. In particular, I sometimes think of it as a sort of bridge between purely behavioral measures like accuracy and response time and purely neural measures like EEG and fMRI. We're not directly measuring some kind of brain activity, but then again, we know enough about how eye movements are controlled cortically (and sub-cortically) that measuring them carefully can give us insights into neural processes in a way that participants' button-pushing in standard cognitive tasks usually doesn't. Before we talk through what's in these studies, I want to give you a quick primer about how eyetracking works and what it can and can't do.
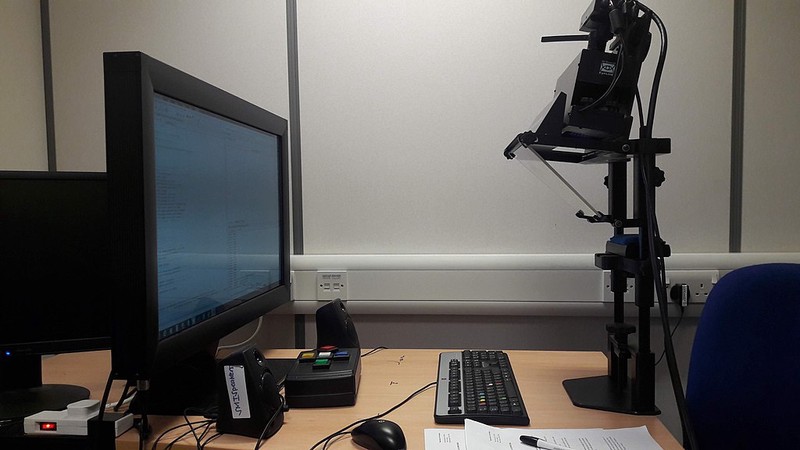
An example of the kind of eyetracker lots of vision scientists keep in their labs to measure where participants are looking during different visual tasks. Rai S G Bari, CC BY-SA 4.0 <https://creativecommons.org/licenses/by-sa/4.0>, via Wikimedia Commons
How do you measure where someone is looking?
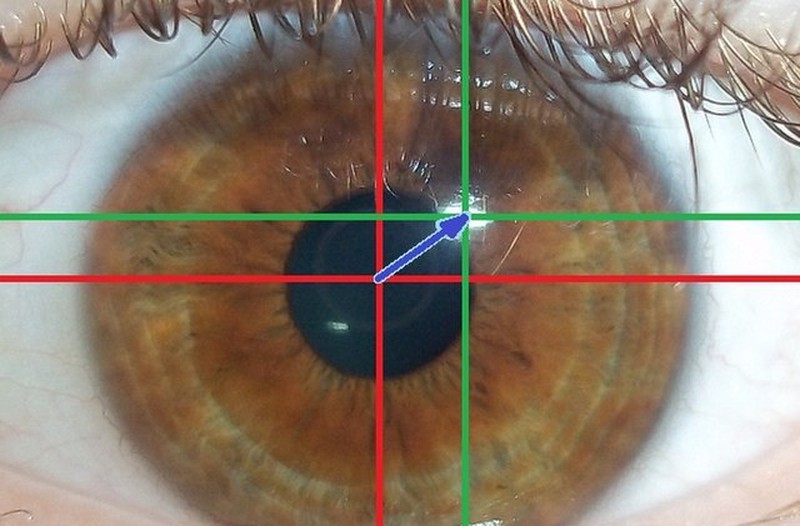
Eyetracking gear can look elaborate and science-y and high quality research instruments are expensive. The basics of how you measure where someone's gaze is being directed within a 2D image aren't all that bad to understand, however. The whole enterprise depends on keeping track of just two things: The picture your participant is looking at and what their eye(s) look like. Below you can see a typical example of the kind of picture an eyetracker might take of your eye to estimate your gaze.
Rai S G Bari, CC BY-SA 4.0 <https://creativecommons.org/licenses/by-sa/4.0>, via Wikimedia Commons
Eye movements are very fast (up to hundreds of degrees per second) so a good eyetracker needs to take a new picture of the eye many times a second to give you good data about what the eye is doing during any given task. The one that's sitting in one of my laboratory testing rooms takes those pictures at 500Hz, which is pretty good. You don't just take the picture of the eye and stop, however - you need to measure two things in that picture so you can start estimating gaze: (1) The pupil, and (2) the corneal reflection. You can see both of these in the image above at the center of the red and green crosshairs. You're probably familiar with the pupil - it's that large black circle in the middle of the image and anatomically it's the opening through which light can enter the eye. The corneal reflection might be new to you, though - it's that small highlight at the center of the green crosshairs. The cornea is a layer of transparent tissue that both protects the eye and refracts incoming light to help focus images on the retina. Like other transparent materials, light both passes through the cornea and can reflect off of it. The corneal reflection is one example of something called a Purkinje image, which refers more generally to images of objects reflected by the eye. For someone hoping to do eyetracking, the presence of the corneal reflection as well as the pupil in images of the eye makes it possible to estimate gaze by using their relative position as the eye moves around as a clue to where our participant is looking. The trick is this: As you move your eye around a 2D image, the movement of the pupil will tend to place the corneal reflection in different positions relative to the pupil (see below). If I can remember which arrangement of the two corresponds to a specific point of gaze, each time I see that arrangement later on, I'll know you're looking at that spot.
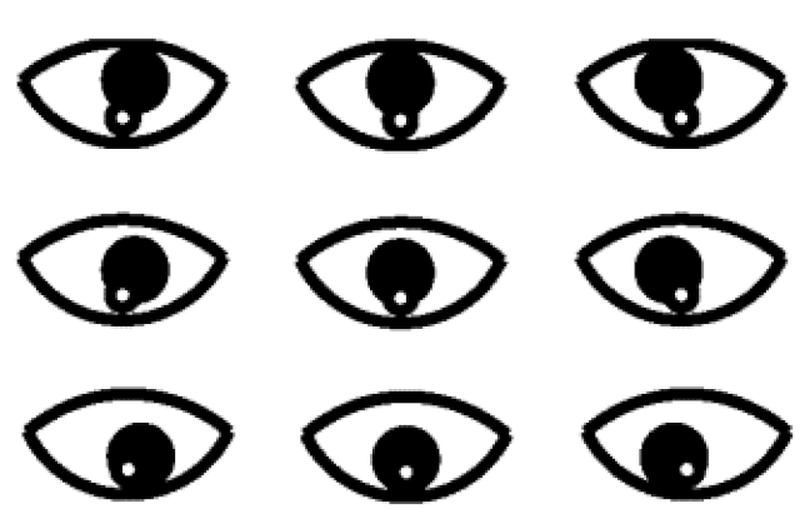
Xerostomus, CC BY-SA 4.0 <https://creativecommons.org/licenses/by-sa/4.0>, via Wikimedia Commons
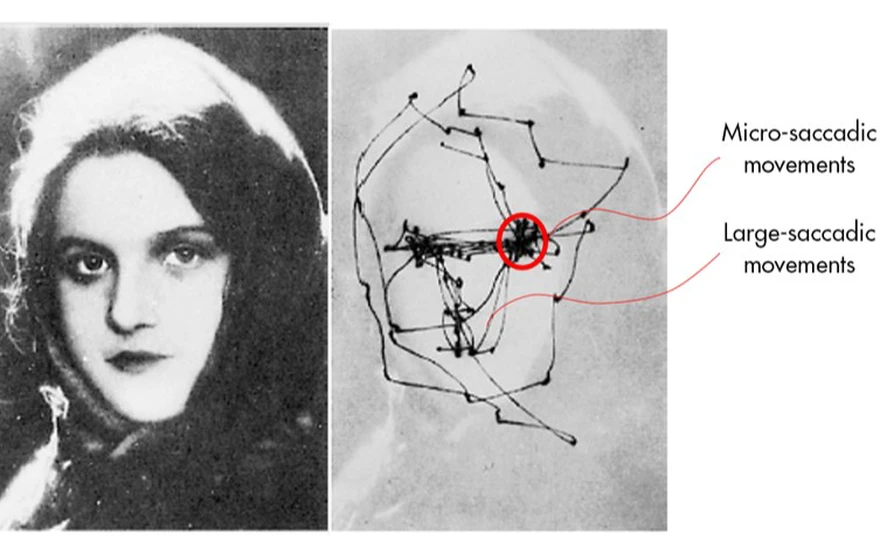
The real trick is to carry out a calibration step before we do anything. In this short procedure, an experimenter will usually ask you to look at a series of positions on the screen (often a grid of high-contrast crosses or dots) one at a time, while they indicate to the computer when you're looking at each one. This yields a small library of correspondences between the pupil/CR relationship and x,y locations on the screen. Forever after (with a caveat or two), we can use that small library to keep track of your gaze by measuring the pupil/CR relationship and interpolating between locations we know something about from calibration. The underlying math needs to be carried out at the same rate that we take pictures of the eye (so like 500Hz for my eyetracker) but it turns out to be not all that complicated at the end of the day. This process allows us to get records like what you see below of how the human eye moved across a complex image while trying to make different judgments about the scene being presented.
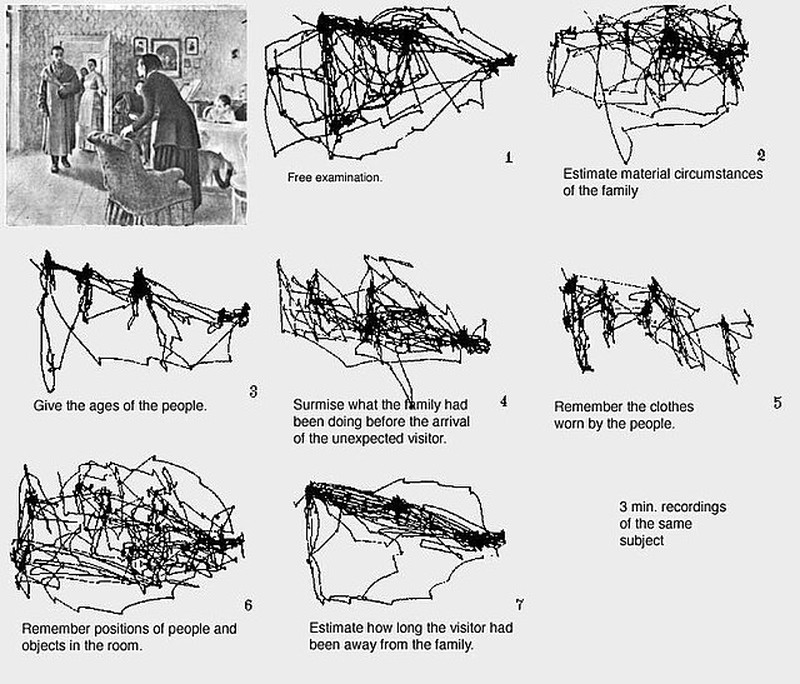
This data is from a classic study by Yarbus (1967), and is often used to show off to students why eyetracking might be interesting: Look at how differently you scan the image for visual features depending on what you're trying to do! Surely these traces or scanpaths of eye movements tell us important things about the information that is important for making certain judgments, or at least the information that people think is important for doing so. This image, and similar images of heatmaps that provide a different kind of visual record of where the eye went during a particular task, are indeed very compelling. It's very tempting to just look at these images and start brewing up theories about what's happening in the brain and mind of your participants. There are some caveats to keep in mind, however, that I want to point out before we start looking at data from chess players.
First, eyetracking might have sounded easy when I talked through how we use the pupil and corneal reflection to measure gaze, but there are a lot of things that make it difficult. That mapping between the pupil/CR and the image depends a lot on keeping the head very still during measurement, which is why most table-mounted eyetrackers have some kind of chin rest and head bar built in to stabilize the head. As you might imagine this is both uncomfortable and an imperfect solution, meaning that gaze estimates always have some error and/or drift to them. A top-notch eyetracker probably gets you down to like 0.5 degrees of visual angle precision, but your thumb at arm's length takes up about 2 degrees of visual angle (depending on the thumb and the arm, of course). Not bad, to be sure, but that amount of space matters when you're talking about pieces packed together on a chessboard. Errors in finding the pupil and the corneal reflection introduce their own noise to our data as well! Blinks, long eyelashes, variation in eyelid shape, and a host of other ordinary sources of variability each make these errors potentially larger, which is important to keep in mind.
Second, once you've measured all this stuff, what do you do with it? This is very dense data, after all. Think about how long you spend looking at a chess position and deciding what to do. Even if it's just a few seconds, multiply those seconds by 500 to come up with the number of data points we'll get from my eyetracker describing where you looked. At the end of the day, we want to look at that big pile of numbers and compare it to another big pile of numbers that came from another player (maybe a titled player who is much better than you) or may have come from you when you were doing a different task (maybe looking at a scrambled position, which is a common control in chess studies). But how? We always need some way to make statistical statements about when we do and don't have evidence for differences across conditions or participant groups, which is its own challenge.
With all that in mind, however, I think the two papers I'll write about in these posts each present some interesting results which highlight how we can try to use eyetracking to draw conclusions about how we look at chess positions, and how looking may relate to seeing pieces, squares, and potential moves in different ways depending on our playing strength.
Charness et al., 2001 (Memory & Cognition) - Reading between the lines?
This first paper stood out to me as a nice demonstration of how to use eye movement information from an eyetracker to draw some simple, but compelling conclusions about perceptual differences between players of varying strength. It's a nice starting point for seeing how there can be many ways to analyze eye movement data, each of which reveals something specific about how visual information appears to be processed during the completion of some task. Speaking of task, this study uses a fairly straightforward one: Given a chess position (or in this case, 5 chess positions that have been normed before the study began), determine the best move you can make. To help minimize uninteresting variability in eye movements across participants, each trial begins by having the participant look directly at (or fixate) the place on the screen where the center of the board will be once it is visible. Then the board appears, the participant probably moves their eyes around, and eventually they report what they think the best move. The question is, do stronger players (2100-2350) do anything different than intermediate players (1400-1900) in terms of how they move their eyes?
Remember what I said up above about just how much data you get from a task like this. The median response times in this task were on the order of 15 seconds or so, and with their eyetracker was measuring gaze 250 times a second! What kinds of descriptors can you use to try and draw conclusions about differences between the groups? I'll divide what they did into two categories: Distributional information about saccades (eye movements) and distributional information about fixations (places where your gaze rested). One way to start crunching your eye movement data is to use that 250Hz record of eye position to determine when people were letting their eyes sit at one location (a fixation) or moving their eyes from one place to another (a saccade). This is it's own neat problem to solve, but let's assume that we can do it. the result is going to be a new collection of data points that you can start asking questions of: (1) For all the saccades that you've found, how big was each one? Did they move their eyes just a little, or a lot? We can call this the saccade amplitude of each eye movement. (2) For each fixation that happened, how long did it last? Did their eyes stay put for a little bit of time, or for a long time? We can call this the fixation duration. Each of these is a number we can calculate for each of the relevant data points and we can use those numbers to both make plots of the data and conduct statistical tests. Here's what the distribution of saccade amplitudes and fixation durations looked like for intermediate and expert players in this study.
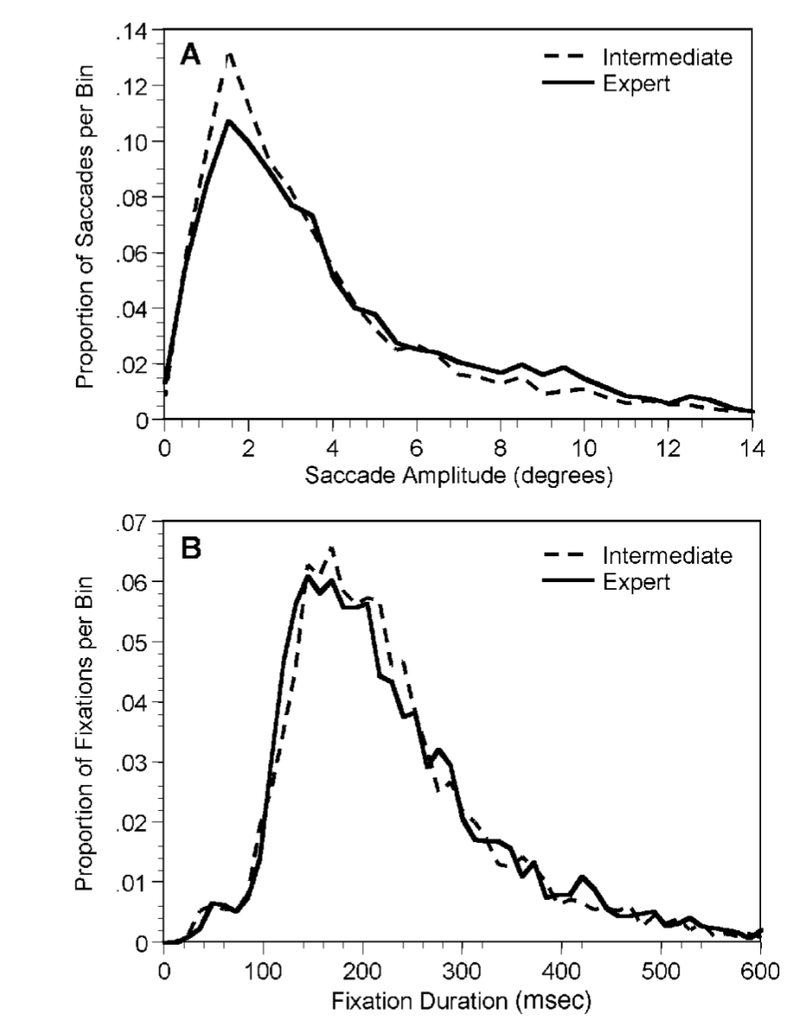
Figure 2 from Charness et al. (2001a) showing both the distribution of saccade amplitudes in each group of participants (top panel) and the distribution of fixation durations in both groups (bottom).
If you find these graphs tough to parse, I can cut to the chase for you: There are differences between the groups with regard to saccade amplitude (how far the eyes moved when they moved) but not with regard to fixation duration (how long the eyes stayed in one place). What does that difference in saccade amplitude mean? To be very concrete about it, in this case it means that the stronger players tended to move their eyes further when making an eye movement - intermediate players made more small eye movements (about 3 degrees on average, which was about a square and a half on the board), while stronger players made larger movements from one spot to the other. That's the numerical effect, but what does it imply about how players are examining the board visually? One idea is that the stronger players may be able to more rapidly recognize an arrangement of pieces within a large region of the board and thus "sample" the whole visual structure of a position with a small number of eye movements that make big jumps between sectors of the position. This depends on stronger players being able to do some things with their vision that are a little surprising and that we'll talk about in a second - for now, though, I hope this proposal makes some sense and helps you see how measuring something about the way the eyes move starts to imply how visual information might be encoded by different participants.
I said that I was going to talk about two categories of their data, however, and that was just one. The second way to describe all this eye movement data that I want to highlight here is probably going to seem a lot more intuitive to you: Where did the eyes actually go? Does the position of the eyes vary across our groups at all, and does this tell us something about possible perceptual differences between intermediate and expert players? To answer this question, we have to come up with another kind of summary of our data in terms of where the eyes were and this will also depend on divvying our data up into saccades and fixations, but we're going to ignore the saccades this time around. Instead, we are going to focus on our fixations and pay special attention to the x, y coordinates of where each fixation occured: Is there a different distribution of x,y, coordinates in our two groups? One simple way to tackle this question is to define areas of interest (or AOIs) on the images that participants saw in our experiment. An AOI is just a part of the image that we've decided is important and a way to summarize our fixation data for each participant is to just count how many fixations (or the total duration of fixations) there are in that region compared to other AOIs. In this study, they did this by labeling pieces on the board as either salient or not salient to reflect their relevance to working out the best move in the position. Below you can see how AOIs are drawn around the squares where salient pieces are positioned.
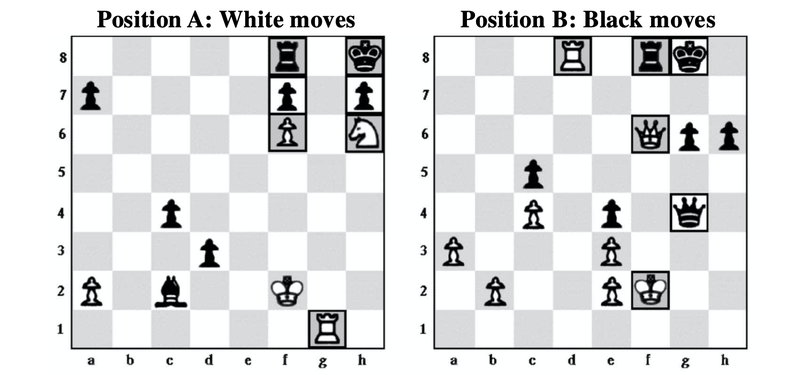
Adapted from Figure 1 of Charness et al. (2001a) - The squares with a dark outline are salient pieces that together make up a large AOI for this task.
With these in regions in hand, we can start to compare our two groups again, this time with regard to the spatial distribution of where their eyes landed. Did the two groups differ in terms of how they distributed fixations to salient and non-salient pieces? As it turns out, they did: The researchers looked at just the first five fixations each participant made in each position (another interesting data decision we could talk about!) and found that experts distributed more of these to salient pieces (about 80%) than intermediate players did (about 64%). By itself, this is maybe neat to see but a little unsurprising - the expert players were better able to look at the most relevant part of the board quickly, which you may have guessed would be true. I feel the need to say here, however, that even if this seems obvious to you there is still value in actually measuring the thing and testing the prediction! Lots of things that seem obvious don't turn out to be measurable effects, after all, and seeing which of your intuitions do and don't come out in the wash is important. We're not done, however, because there is another neat difference between intermediates and experts here that is both (I think) less obvious and leads to some neat ideas about the perceptual mechanisms that support expert-level play.
Those proportions I listed up above were the proportions of fixations to salient pieces as opposed to non-salient pieces. That is, we only paid attention to the fixations that landed on a piece in the first place. If you were looking at a piece, how often was it a salient one? There isn't any rule that says players can only look right at the pieces on the board, however, and the eyetracker itself certainly doesn't care about the board, either. What about all the fixations players in both groups made? Take a look at the scatterplot of fixations below and see if you can spot the interesting thing going on that separates the two groups in this task.
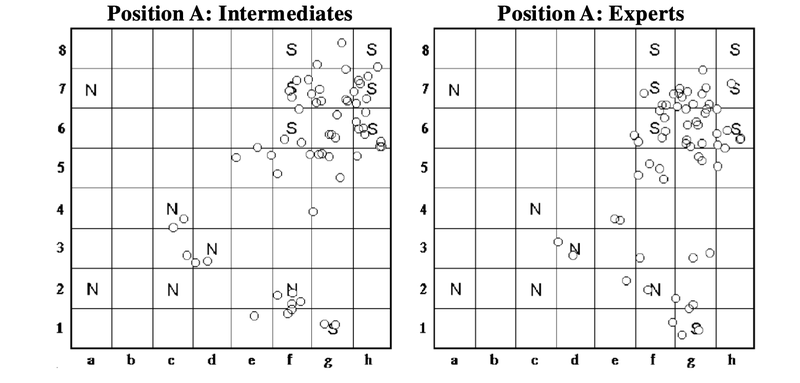
Adapted from Figure 3 in Charness et al., (2001a). Distributions of fixations (open circles) by intermediates and experts looking at the same position, with salient pieces and non-salient pieces labeled as S and N, respectively.
To be honest, I shouldn't have asked you to do that. One of my pet peeves about visualizations of dense data sets is the part where people sort of squint at them and say "I think I see <insert random thing here that you don't see> ...you should definitely run an analysis to check that out." There are a lot of very good reasons not to do that sort of thing (it wouldn't be very chess-oriented, but I could write a whole article about that), so let me again cut to the point that the researchers want to make with this data: The experts look at empty squares more often than intermediate players! Across all fixations, experts look at empty squares just over half the time (~52%) while intermediate players only do so about 40% of the time on average.
Saccades, fixations, what does it all actually mean?
This is where I'm going to leave off for now because I hope I've accomplished two things here. First, I wanted to give you a sense for what eyetracking methods let us measure and how that process actually works in terms of the equipment you use and the procedures you carry out to do the work. Second, I wanted to use this study to show you how eyetracking data can let us measure a bunch of different things about visual behavior at once, each of which has the potential to inform us about differences in eye movements across tasks, stimuli, or participant groups, that in turn may imply differences in perceptual mechanisms employed to support complex visually-guided behaviors. This paper reveals a couple interesting differences between intermediate and expert players that lead to a neat hypothesis about perceptual differences between players as a function of playing strength. In Part 2 (probably out in a week or so) I'll say more about what that hypothesis is and how another paper from the same group of researchers uses eyetracking in some different ways to examine that idea further. Stay tuned, and thanks as always for checking out this blog.
Support Science of Chess posts!
Thanks for reading! If you're enjoying these Science of Chess posts and would like to send a small donation ($1-$5) my way, you can visit my Ko-fi page here: https://ko-fi.com/bjbalas - Never expected, but always appreciated!
References
Charness, N., Reingold, E. M., Pomplun, M., & Stampe, D. M. (2001). The perceptual aspect of skilled performance in chess: evidence from eye movements. Memory & cognition, 29(8), 1146–1152. https://doi.org/10.3758/bf03206384
de Winter, J., Koelmans, T., Kokshoorn, M., van der Valk, K., Vos, W., Dodou, D. & Eisma, Y.B. (2023) A Role of Peripheral Vision in Chess? Evidence from a Gaze-contingent Method. Journal of Expertise, 6, 1, 23-39.
Sheridan, H., & Reingold, E. M. (2017). Chess players' eye movements reveal rapid recognition of complex visual patterns: Evidence from a chess-related visual search task. Journal of vision, 17(3), 4. https://doi.org/10.1167/17.3.4.
Reingold, E. M., Charness, N., Pomplun, M., & Stampe, D. M. (2001). Visual span in expert chess players: evidence from eye movements. Psychological science, 12(1), 48–55. https://doi.org/10.1111/1467-9280.00309
Yarbus A. L. (1967). Eye movements and vision. New York: Plenum.
You may also like
 NDpatzer
Science of Chess: What does it mean to have a "chess personality?"
What kind of player are you? How do we tell? NM RyanVelez
I want to improve, but I'm busy !!!
This article is for people who want to improve but are busy, and for anyone who wants to know how to… NDpatzer
Science of Chess - Achtung! Einstellung!
Pattern recognition is great, but the Einstellung effect can turn a master into a patzer (sort of). Lichess
FIDE adjusts its ratings to be more in line with Lichess (not really)
When Elo meet Glicko! NDpatzer
Science of Chess - Candidate Moves, David Marr, and why it's so hard to be good.
A bird's-eye view of the cognitive and perceptual factors that make chess so tough. NDpatzer