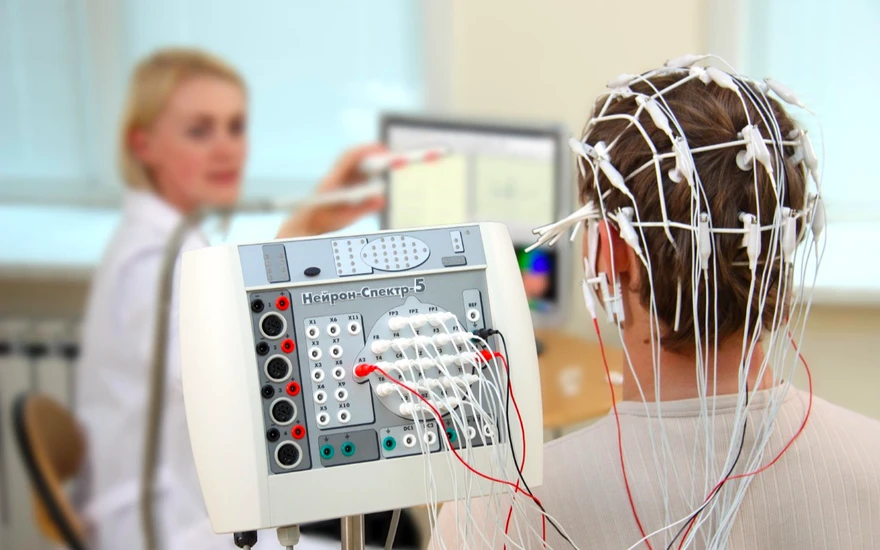
Baburov, CC BY-SA 4.0 <https://creativecommons.org/licenses/by-sa/4.0>, via Wikimedia Commons
Science of Chess: What happens in the brain when we see the best move?
EEG is good for measuring the timing of neural events, but can it reveal what happens when insight hits?If you, like me, are a squarely average player, looking at a puzzle like the one below presents you with about a 50/50 shot at getting the right answer. Surely there is some tricky tactical play that leads to a clear win? Then again, is there a quiet move we need to play first to set the stage for the fireworks? Occasionally I see the best move straightaway, but more often than not I don't - instead, I look around the board, I try to calculate a bit, and hopefully after some amount of cogitating I'll see it.
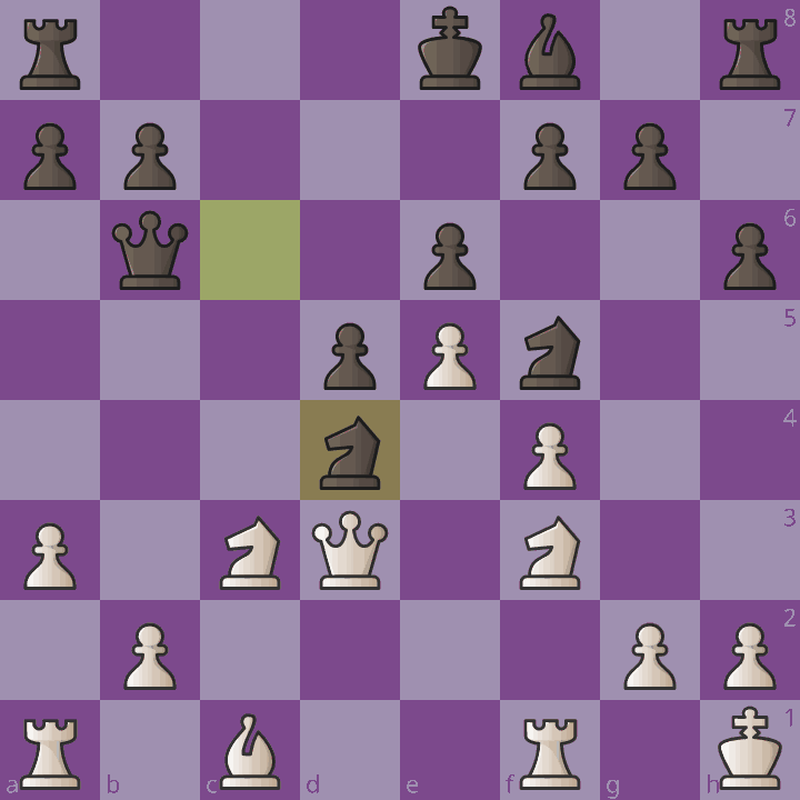
Lichess puzzle #FxRQ4, White to move.
I'm interested in a lot of things about the brain, most of which are about visual processing (the focus of my lab's research). When I first started studying cognitive neuroscience, though, I remember my Mom telling me what she wanted to know about the brain: "What happens when you suddenly figure something out?" she asked, "That moment when you're stuck on a problem and then you just "get it" all at once - can you find that?"
Great question. Not just a great question in general, but perhaps a particularly great question to ask in the context of playing chess: Aren't we all constantly hoping that when we look at a position we'll be able to "get it" and see our way to the best move? Similarly, haven't we all kicked ourselves every now and again for failing to have the crucial insight while looking at a position from one of our games? In this post, I'll tell you about a project I recently read about that I think is a great addition to my Science of Chess series for two reasons: First, it describes an attempt to find and measure moments of insight like this during a chess game - what's the brain doing when you work something out during play? Second, it includes a method for measuring neural activity that I haven't talked about in depth before, which turns out to be a potentially important way to measure fleeting moments of cognitive processing (and hopefully brilliance!) while we carry out everyday tasks.
Using EEG to measure when things happen in the brain
In previous posts, I've talked about the use offunctional magnetic resonance imaging (or fMRI) as a tool for investigating where things happen in the brain when you do various tasks. In the context of chess research, fMRI studies have been used to identify a network of brain areas that contribute to playing chess, including regions in the occipital, parietal, and frontal lobes that are known to support visual perception, spatial cognition, and decision-making, respectively. Connecting specific aspects of chess to brain areas that have been independently linked to distinct kinds of cognition is one way of trying to use neural data to characterize what the mind is doing to play the game.
One important limitation of fMRI as a means of measuring neural activity, however, is that while it's good for telling us where things are happening in the brain, it is quite poor at telling us when things are happening in the brain. The reason for this (without going too deep) is that fMRI indirectly measures neural activity by measuring the concentration of oxygenated blood in neural tissue. This increases in parts of the brain that have just been active, so measuring oxygenated blood in the brain is a useful stand-in for the activity itself. The trouble is this, however: While neurons produce electrical signals that last for miliiseconds, the flow of oxygenated blood to those cells takes ~6-12 seconds to rise and fall. That's quite slow relative to the actual activity of the cells we're interested in in the first place, which means we can't get away with using fMRI to measure the dynamics of neural activity.
What's the alternative? An important (and I would say complementary) method for measuring brain activity is electroencephalography (or EEG for short). Rather than measuring blood flow to active neurons, EEG uses sensors placed on the scalp to passively measure the electrical activity of the cells themselves. Again, without going too deep into the physiology, when we talk about neurons being active, what we mean is that these cells are producing electrical signals called action potentials or "spikes" that can in turn produce activity in the cells that they are connected to. EEG doesn't measure the spikes directly, but instead reflects changes in electric potential resulting from neurotransmitters binding to a neuron. Those signals conduct through the space between the cells (which is called the extracellular matrix), through the brain, through the skull and the scalp, until they reach the sensors that we can place on a participant's head in the laboratory. Each one of those little plastic discs that you see in the cover image for this post is one such electrode, sitting on the scalp and sending data to a computer about how the voltage at that electrode is changing over time. You can see what that activity might look like in the figure below.

One second of EEG data obtained from an electrode positioned over the occipital lobe (the back of the head). Image created by Hugo Gamboa Dez 2005
The good news (if we care about measuring when things happen in the brain) is that the electrical signals we're measuring with EEG are fast - about as fast as the neural activity itself. That's a lot better than we could do with fMRI, though we're giving up our ability to say much about where the activity came from. That's part of the bad news. The other part of the bad news (that turns out to be not-so-bad) is that the line graph above probably looks like a mess to you. You'd be forgiven for wondering what on Earth you were supposed to get out of this measurement - we apparently have one second of brain activity to look at here, but what exactly is there to see? The line goes up, the line goes down, but what does any of it mean?
Measuring the timing of neural events with ERP
One way (but not the only way) to use EEG to say something specific about the timing of neural events is to use a technique called event-related potentials, or ERP. The underlying measurement is the same - we're still going to be recording changes in voltage at scalp electrodes which reflect fast changes in neural activity from groups of neurons in the brain. The new idea is that we're going to use those measurements to estimate systematic changes in that signal over time relative to an "event" that we want to know about. An event could be any number of things: An image that a participant sees, a sound that they hear, or a response that they make in a task. Whatever the event is that we want to study, we carry out a series of steps to estimate an ERP from continuous EEG data:
- As we record EEG at our electrodes, we make sure to record when the events we're interested in happened. Every time a participant saw a picture, for example, we might insert a marker into our EEG recording.
- After the recording is done, cut up the long record of neural activity at each electrode using the events to guide us. We might divide our EEG recording up into pieces so that we always include data for the half-second before the event and the full second after it happened. When we're done, we should have lots of little pieces of EEG data that are all (in this case) 1500ms long and have the critical event in the same place.
- Finally, take all of these pieces of EEG data from a particular electrode and average them together. The idea (depicted below) is that any changes in voltage that weren't consistent responses to the event should be pretty unrelated to one another and will wash out as we average our pieces together. On the other hand, anything that happened consistently before or after the event should not wash out, leaving us with a record of what we measured on average at our electrode for the period of time around our event. This record is our ERP.
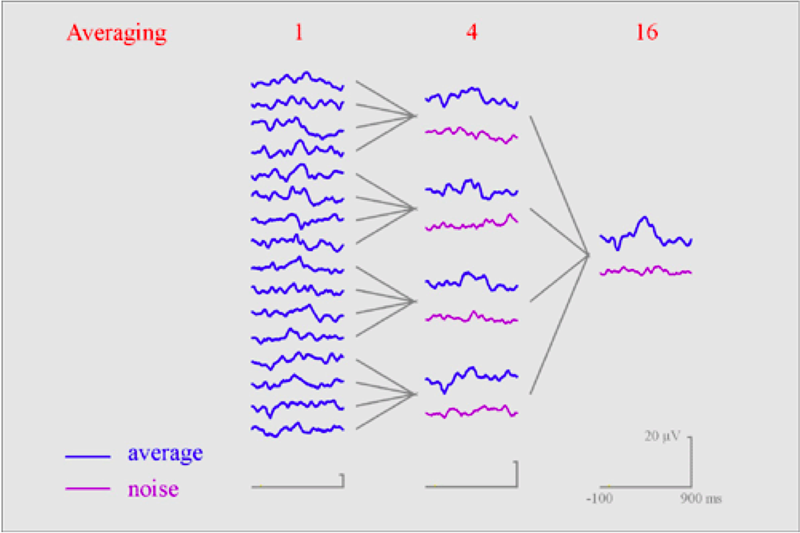
As we average together snippets of EEG data that are time-locked to a shared event, random fluctuations in the signal should cancel out, but systematic changes in response to the event should persist. The resulting average response to the event (the blue waveform at the far right) is our event-related potential or ERP.
The interesting thing about ERPs is that they don't tend to look random. Instead we often see systematic structure in the average waveforms we can estimate using the steps that I described above. Specifically, the waveform will usually include positive and negative bumps that are frequently referred to as ERP components. You can see an example of a pretty classic ERP waveform below with positive bumps plotted downward (I know, I know, but this turns out to be a thing people do in the literature), negative bumps plotted upward (again, sorry), and all of these components labeled according to the direction of the deflection (P for positive, N for negative) and the order in which they occurred in the waveform (1 for first, 2 for second, and so on). A great deal of ERP research focuses on understanding how changing the task people are doing, the properties of the images and sounds that they are seeing, or other features of your experiment may change either the height (or amplitude) of these bumps and the time it takes for them to reach their peak (the latency of the component). Thankfully, at this point in the field we have a large literature of what my colleague Dr. Steven Luck sometimes refers to as "ERP-ology" linking these bumps to specific cognitive processes. In my lab, for example, we've done a lot of work examining a component called the N170, which turns out to be a component that is sensitive to images of faces. Because lots of groups have done prior work to measure this component and what it seems to reflect about vision, our lab feels fairly secure in using it as a tool to further explore how face processing is affected by new changes to the tasks we ask people to do with faces or the specific pictures we show them.
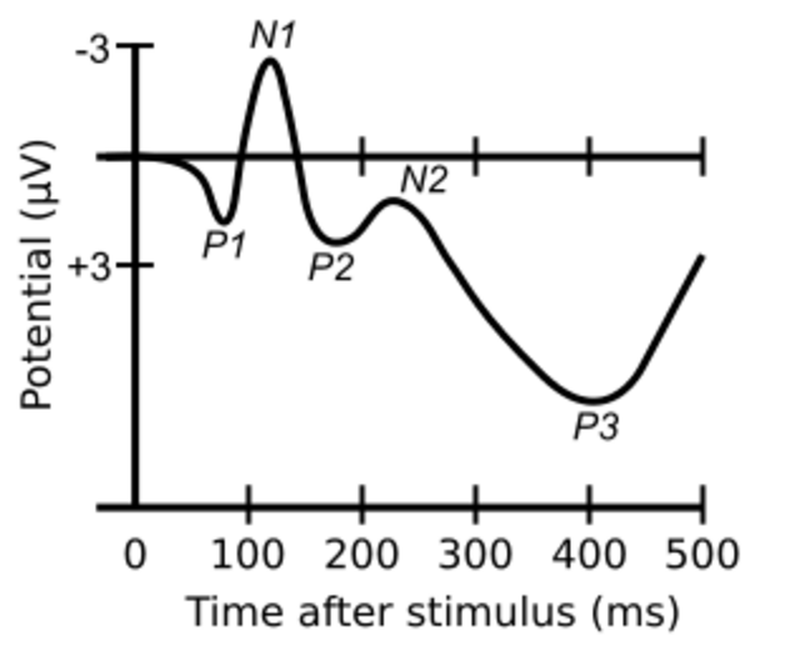
A typical ERP waveform in response to a visual stimulus. The various positive and negative bumps in the graph are often referred to as components and have been linked to specific perceptual and cognitive processes in prior studies. Original: Choms Vector: Mononomic, CC BY-SA 3.0 <http://creativecommons.org/licenses/by-sa/3.0/>, via Wikimedia Commons
One way to do novel ERP research is to work with a component like this that you feel like you understand pretty well, and use it as your means of characterizing the process that you think it reflects. However, all that "ERP-ology" I mentioned up above doesn't mean that we have anything close to a full library of which mental activities lead to which components in an ERP waveform. Far from it! This means that there is plenty of room to ask questions that don't depend on knowing what you're looking up front, but instead are more exploratory: If we have some new task we're interested in, what kind of component structure do we find if we estimate an ERP? It's this second kind of question that the author of our target article set out to answer.
Using ERP to try and find an "A-ha!" moment
Back to the scenario I started this post with: Suppose we're looking at a typical puzzle and after a few moments of consideration we hit upon a solution. What is the systematic response in the brain (if there is one) that reflects our sudden insight into the problem? The author of our study (E. Hageman, who I want to point out completed this work as an undergraduate thesis) hit upon a straightforward way to use ERPs as a means of investigating this issue.
The main idea is as follows: Ask a group of chess players (N=25 in all, with an average FIDE rating of ~1800) to consider a series of mate-in-two puzzles (you can see a sample puzzle below). While they're working out what to do, measure continuous EEG with the aim of estimating ERPs in response to key events during the testing session. But what are those key events? What I really like about this study is that the author chose to estimate ERPs by time-locking the EEG signal to two different events, one that focuses on the puzzle stimulus itself and another that reflects the act of completing it.
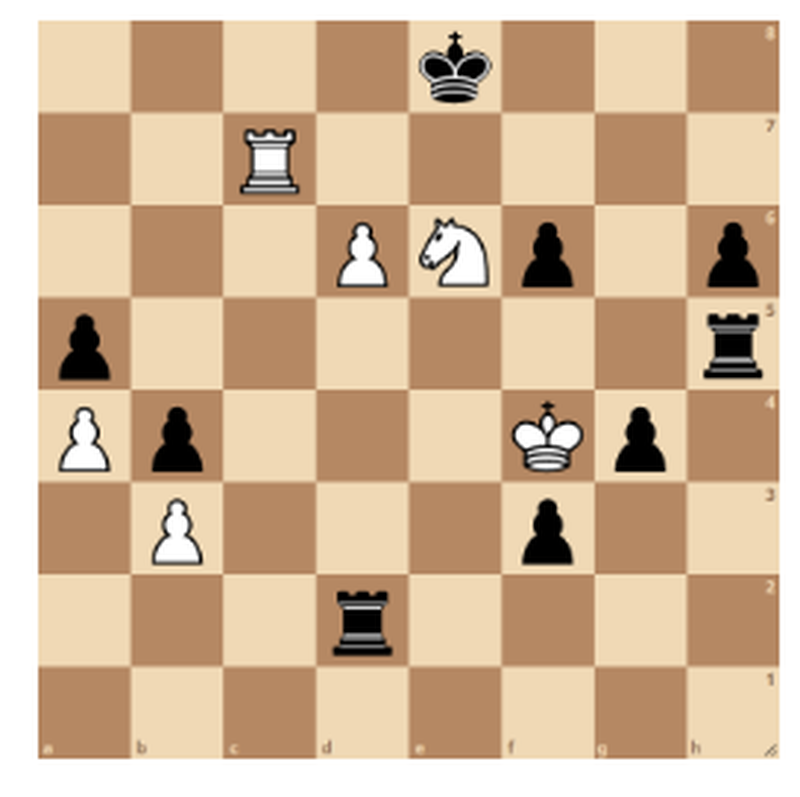
An example puzzle used in Hageman, (2021). All of the puzzles used in this study required White to move first, some with a sacrificial theme and others without. Curiously, though the author describes all of the puzzles as "mate-in-two" and offers this as an example, a reader pointed out that 1. Re7 appears to be mate in one.
The first event that the author used to measure ERPs in response to mate-in-two puzzles was what we call the stimulus onset. That may sound a little technical, but all this means is that the event used to segment the EEG record was the moment that each puzzle image appeared on the display. This strategy for measuring the average neural response to a puzzle is likely to yield components that reflect the initial visual processing of the image, as well as slower processes that may be related to higher-order perceptual processes like grouping, initial comparisons between what's on the board and patterns the player may have seen before, and other rapid/automatic visual cognition processes.
It's the second choice of event that I think is fun, however, and has the best potential to reveal what a moment of insight looks like over the board: The author chose to estimate different ERPs that were not time-locked to the puzzle image, but were instead time-locked to a correct response to the puzzle. The idea here is that the key event for estimating what happens when you solve a puzzle is the moment you report the right answer. Actually, that moment isn't the important thing - instead, it's what was happening in the brain just before that moment that we're interested in. Thus, in contrast to the first set of stimulus-locked ERPs I described, in this case the author wanted to go looking for component structure prior to the key event, not afterwards.
Puzzle perception is measurable, puzzle solving is more elusive
So what happened? First, here are a few details about participants' behavior (not their neural data) to get you oriented to what you're about to see in the ERP waveforms. The author included 100 puzzles in each testing session, all of which were solved with White to move. Participants were given as much time as they liked to attempt each puzzle, and only correct answers were used as the basis for estimating ERPs. That still yields a lot of trials as it turns out - average accuracy was above 90%. You also probably aren't going to be surprised to hear that higher ELO ratings correlated strongly with accuracy (higher ELO predicts higher accuracy) and reaction time (higher ELO predicts faster correct responses).
But what about the brain? Below, I'm showing you the author's figure depicting the ERP waveforms measured over different parts of the scalp (F, T, C, P, and O refer to frontal, temporal, central (top of the head), parietal, and occipital sites, respectively) for the stimulus-locked ERPs. Remember that these waveforms likely reflect initial perceptual and cognitive processing of the puzzle, but aren't specifically linked to arriving at a solution. You'll also see that there are actually two waveforms per electrode site: The orange line depicts the waveform for puzzles that had a sacrificial first move, while the green line depicts the waveform for puzzles that did not.
The thing to look for here are components: Are there systematic positive or negative deflections following the stimulus-onset event (marked with the vertical dashed line)? I hope it's clear that the answer to this is a resounding "Yes." To my eye, there is clearly a component that I would call either an N2 or N200 (the large negative dip shortly after the onset event) and another one that I would probably call a P300 (the large positive bump that comes after the negative one). Seeing these components in the stimulus-locked waveform is reassuring because these are components that previous ERP studies of chess have also found. These aren't the focus of the author's study, so I won't give you a full run-down of what prior groups have suggested about the links between these components and processes that contribute to chess-playing. For now, I'd say the takeaway from these results is that the author measured some solid ERPs - the data collection process and the analysis pipeline revealed some predicted outcomes, so we can have some confidence in the overall approach.

Figure A.5 from Hageman (2021) - Grand average waveforms across the scalp that are time-locked to stimulus onset. Both an N200 component and a P300 component are evident, consistent with prior ERP studies of chess.
With that in mind, what about the author's attempt to measure the "A-Ha!" moment? Below, I'm showing you the ERPs they estimated using participants' correct responses as the key event, again separated according to whether or not the puzzle included a sacrificial theme. Remember, unlike the waveforms up above, in this case we're looking for components prior to the response event (marked here with a red dashed vertical line), so bumps to the left of the waveform are critically important.
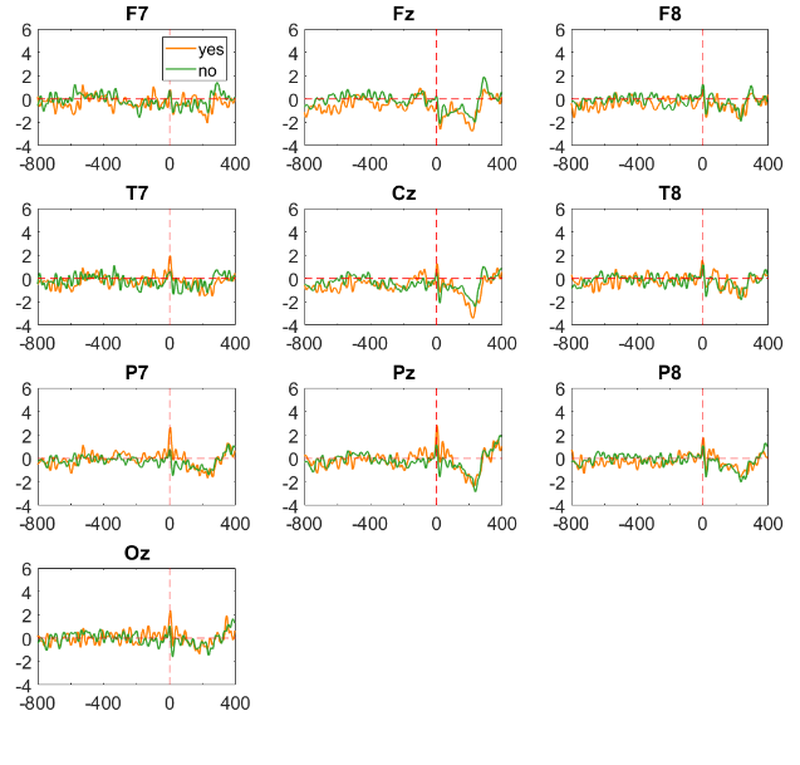
Figure A.6 from Hageman (2021) - Grand average waveforms across the scalp that are time-locked to correct response. You can see those N200 and P300 shapes off to the right, but the critical space to the left of the event doesn't reveal component structure.
But wait - what bumps? If you look to the left of each waveform, I hope you'll agree with me that there doesn't seem to be much to see. Despite the fact that stimulus-locked components were clearly evident in the data, registering our EEG segments to correct responses doesn't leave us with anything systematic in the second before participants pressed the button. Now look, this doesn't mean that there isn't anything happening in the brain when you arrive at the correct answer to a chess puzzle. Instead, this outcome suggests that there may not be a time-locked event that is consistent enough to be measurable with ERP in this time window. The authors brings up a number of different ideas about possible alternatives: Maybe players engage in enough error-checking before actually making the move that "A-ha" moment is more than 800ms before they press the button. Perhaps participants' relative familiarity with puzzles of this type (as evidenced by the high accuracies reported earlier) limited the extent to which there was a real moment of insight, as opposed to something more like memory recall. Maybe different puzzles simply work differently enough that there is too much variability in the timing and amplitude of any process that reflects insight. Finally - and this is the bitter pill we must always consider - maybe there just isn't one easily measurable process to be found.
So now what?
Like any study, this is far from the final word on the subject and there are a lot of interesting things one could try next. Personally, I'm very interested in understanding the mistakes people make when solving puzzles because I think these may reveal a lot more about cognition than the right answers. It's challenging to identify the events you need to estimate ERPs when players don't succeed, of course - success comes in moments, I'd argue, but failure persists. Still, it might be the case that understanding insight in the brain might depend on comparing "A-ha" moments to their absence. There are also a bunch of experimental levers one could pull to mix up puzzle type, familiarity, difficulty, and a host of other parameters that might yield different outcomes. For now, however, I think this study was an excellent attempt to try and hunt down the moments we live for over the board and how they're reflected in the activity of the neurons that allow us to play the game at all.
Support Science of Chess posts!
Thanks for reading! If you're enjoying these Science of Chess posts and would like to send a small donation my way ($1-$5), you can visit my Ko-fi page here: https://ko-fi.com/bjbalas - Never expected, but always appreciated!
References
Hageman, E. (2021) When the brain goes "Aha!": a study on Event-Related Potentials during the moment of insight. Bachelor's Thesis, Artificial Intelligence. Rjiksuniversiteit Groningen.
Kounios, J., & Beeman, M. (2014). The cognitive neuroscience of insight. Annual review of psychology, 65, 71–93. https://doi.org/10.1146/annurev-psych-010213-115154
Luck, S.J. (2012) An Introduction to the Event-Related Potential Technique, MIT Press, Cambridge, MA.
Wright, M. J., Gobet, F., Chassy, P., & Ramchandani, P. N. (2013). ERP to chess stimuli reveal expert-novice differences in the amplitudes of N2 and P3 components. Psychophysiology, 50(10), 1023–1033. https://doi.org/10.1111/psyp.12084
You may also like
 WFM fla2021
Attacking the King When Both Are Castled on the Same Side
This post provides key strategies and considerations for successfully attacking your opponent's king… IM nikhildixit
3 Unique Stalemates Under 20 Moves
When I showed these games to my students, they were unaware of these stalemates. I thought to share … CM HGabor
Effective training methods - doing tactics
My previous post was about chess training in general. We will dive into the details now. So, what yo… NDpatzer
Science of Chess: Proving yourself wrong
The best players know it's not enough to be right, it's also working hard to find out when you're wr… Lichess
Should I report this?
Ever encountered a user misbehaving on Lichess? Check out if and how to report them. NDpatzer