
Taking a closer look at a single game with engines
I've written a couple of posts in the past where I looked at different aspects of chess games with engines. I did this all in isolation but now that I've experimented with many different scores and graphs extracted from games, I want to use all of them to look at a single game.I'll only give a brief description of each score here and will link to the original posts if you're interested in reading all the details.
I decided to look at game 6 of the Carlsen-Nepomniachtchi world championship match. I picked this game because there were many ups and downs and it was tense for a long time. If you want me to take a look at other games, let me know.
Note that the images are again a bit blurry here, you can read the post on Substack if this bothers you.
Quality of Play
The most basic indicators of quality of play are the accuracies of the players and the number of inaccuracies, mistakes and blunders. I don't find these single numbers too insightful, but I decided to include them for completion.
| Accuracy Score | Inaccuracies | Mistakes | Blunders | |
|---|---|---|---|---|
| Carlsen | 97.4 | 1 | 1 | 1 |
| Nepo | 95.7 | 4 | 0 | 1 |
I prefer to see how the game went instead of some numbers, so I really like the WDL graph of a game. This shows the win, draw and loss probabilities for both sides, calculated by the LC0 engine. Compared to the usual centipawn graph, this gives more insight since an equal position could offer winning chances for both sides or be a dead draw. The evaluation in centipawns "hides" these dynamics, but they can be seen in the WDL.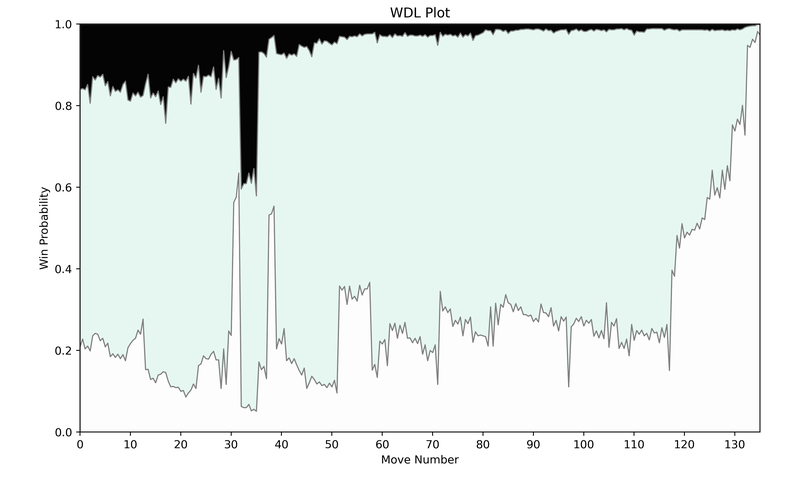
This graph shows that a lot happened between moves 30 and 40. What’s also interesting to see is that afterwards the draw probability was very high, but White could play for a win while Black’s winning chances were minimal.
Sharpness
The WDL in a position can also be used to calculate a sharpness score for a position. The idea behind this score is that a position where both sides have winning chances is considered to be sharper than a position where the drawing chances are high.
To see how sharpness relates to a game, I find it insightful to look at the change in sharpness after each move. If one side plays a move that increases the sharpness, this change will be positive, while a move that decreases the sharpness will lead to a negative value.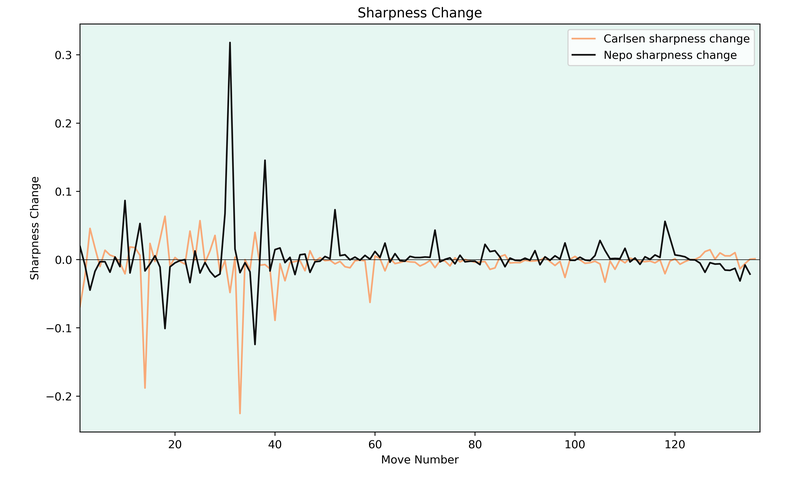
The sharpness graph for the Carlsen-Nepo game doesn't show too many big jumps. There is much volatility around move 30, but this is connected with the mistakes both players made there (see the WDL graph). Once the game settled down afterwards, there weren’t many opportunities to increase the sharpness.
Piece Activity
Another important factor in a game can be the activity of the pieces. To calculate the piece activity, I added up the number of moves the pieces for each side have. I gave bonuses if the piece could move to squares in the opponent's half or squares around the opponent's king. Plotting the piece activity after each move lead to the following graph.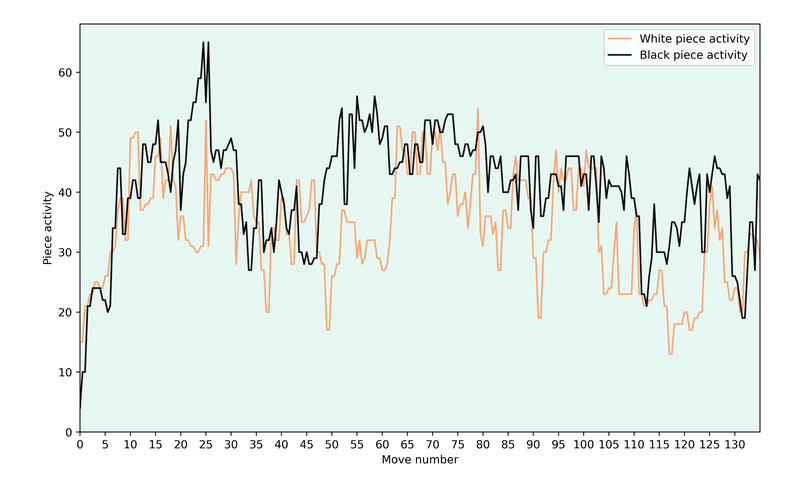
For the first 20 moves, there is no big difference between the piece activity of both sides. Then Black had much more active pieces for moves 20 to 30 and it levelled out again. After move 45 Nepo’s piece activity was again higher (the material imbalance might be a reason for this) even though Carlsen was the one playing for the win.
Piece Heatmaps
Finally, I thought that it might be interesting to look at heatmaps of the pieces.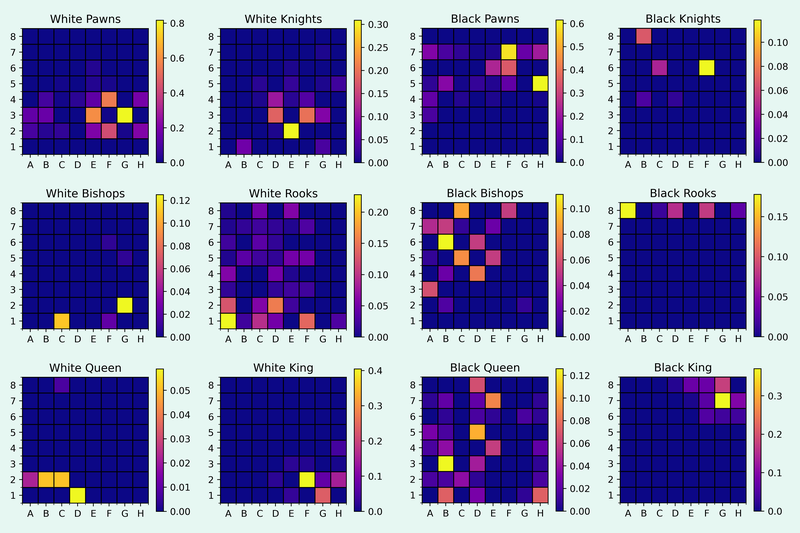
I think that the heatmaps are mostly fun to look at, but one thing that stands out is that the white rooks and the black queen moved around a lot.
What do you think?
I want to do more posts about games and tournaments in the future, especially during the world championship match. So I'm very interested to hear what you think about the various graphs I've shown. You can either write in the forum or vote here about the most and least insightful graph.
If you've enjoyed this post, you might also be interested in an older post where I looked at stats from the 2024 Candidates tournament.
You may also like
 WFM fla2021
Bishop or Knight? Which one to choose?
In this blog post, I want to show you some practical examples to help you understand when a bishop i… jk_182
Do Attacking Players play more Forcing Moves?
Finding forcing moves and looking through the games of world champions WFM fla2021
Attacking the King When Both Are Castled on the Same Side
This post provides key strategies and considerations for successfully attacking your opponent's king… GM NoelStuder
I won 200 rating points with a simple challenge
At the end of July, I set myself a challenge: 30 days, each day 6 games of 3+2 Blitz with full focus. FM CheckRaiseMate
The Power of a Plan
And how to make the engine into an effective teacher jk_182