Optimizing the tablebase server
Hunting down tail latenciesRecently our our 7 piece Syzygy tablebase server was struggling to complete its periodic RAID integrity check while being hammered with tablebase requests. We decided to try a new approach, using dm-integrity on LVM. Now, instead of periodically checking every data block, we passively check blocks whenever they are read.
17 TiB of tablebases are unwieldy, so to do this migration without hours of downtime, we set up a second server with the new approach. This also allowed us to run controlled benchmarks on the full set of tablebases, before finally doing the switch and retiring the old server.
We're trying to get the most out of the following new hardware:
- 32 GiB RAM unchanged
- 2 x 201 GiB NVMe, where the previous server didn't have any SSD space. The rest of the 476 GiB disks is reserved for OS and working space
- 6 x 5.46 TiB HDD, where the previous server had only 5 disks
The current operating system is Debian bookworm with default I/O schedulers:
root@bwrdd:~# uname -a
Linux bwrdd 6.1.0-21-amd64 #1 SMP PREEMPT_DYNAMIC Debian 6.1.90-1 (2024-05-03) x86_64 GNU/Linux
root@bwrdd:~# cat /sys/class/block/nvme0n1/queue/scheduler
[none] mq-deadline
root@bwrdd:~# cat /sys/class/block/sda/queue/scheduler
[mq-deadline] none
Monitoring important as ever
RAID 5 is a good fit here, allowing recovery from any single disk failure, and distributing random reads across all disks. My first attempt was:
$ lvcreate --type raid5 --raidintegrity y --raidintegrityblocksize 512 --name tables --size 21T vg-hdd # Oops
Peformance numbers in initial tests were decent, but we would have left a lot on the table if we didn't have monitoring to catch that not all disks were indeed participating equally.
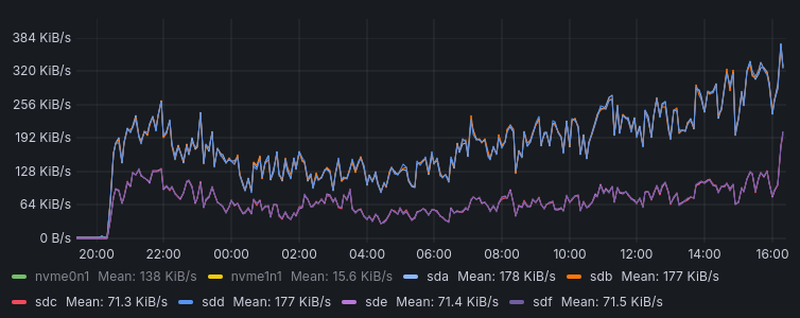
Physical disk read activity with bad raid setup
That's because omitting --stripes does not default to use all physical volumes.
Benchmark results (overview)
In normal conditions the server receives between 10 and 35 requests per second. We record 1 million requests in the production environment to replay them in a controlled benchmark. In the chosen scenario, 12 parallel clients each sequentially submit requests from the production log.
Tables are lazily opened, and application and OS caches are lazily populated. So the first 800k response times are ignored as a warmup. We analyse the response times for the remaining 200k requests.
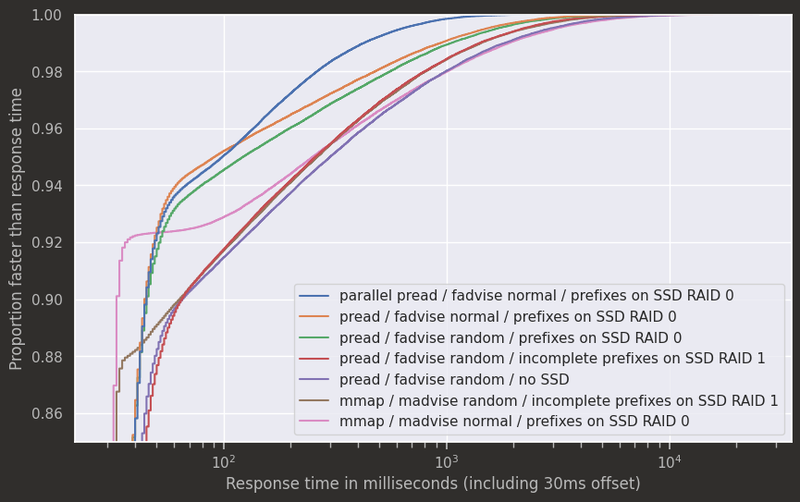
On average, response times are plenty fast, but tail latencies are high. So this is our focus for any optimizations. We'll unpack the results in a moment, but here are the empirical distribution functions (ECDFs) with 30ms added to each response time for an overview.
ECDFs
For a given response time on the x axis (log scale!) you can see which proportion of requests is faster. Or for a given proportion on the y axis (think percentile), you can read off the corresponding response time on the x axis.
The added constant seems artificial, but it's just viewing the results from the point of view of a client with 30ms ping time. Otherwise the log scaled x-axis would overemphasize the importance of a few milliseconds at the low end.
mmap with higher tail latencies than pread
Our Syzygy tablebase implementation shakmaty-syzygy now offers an interface to plug in different ways of opening and reading from table files. The main contenders are:
- Map table files into memory. After the file has been mapped, disk reads happen transparently when accessing the respective memory region, so no further system calls are needed. Unfortunately, that also means reads look just as infallible as normal memory accesses, so that errors can only be handled out of band, via signals.
- pread(2), one system call per read, with read error reporting via the return value.
More robust error handling would probably be enough to justify using pread for a server implementation, but surprisingly, the diagram above shows that pread also peforms better in the scenario we care about. Perhaps that is because sometimes transparently reading a single memory-mapped data block across page boundaries may end up issuing two disk reads
while (...)
{
    uint8_t d = *ptr++;
}
whereas
uint8_t buf[MAX_BLOCK_SIZE];
ssize_t res = pread(fd, buf, block_size, offset);
immediately reveals how much data will be read.
Now, before you change your chess engine to use pread: Tablebases in engine matches are typically used only if enough fast storage for all WDL tables is available. The typical range of response times is not even visible in the graph above. Here, the saved syscall overhead is significant, so that memory mapping performs better.
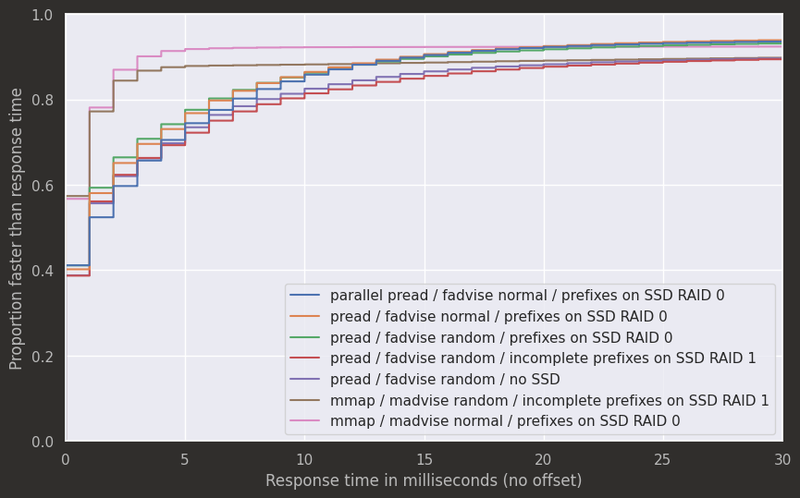
Zoom on ECDFs: mmap saves syscall overhead
MADV_RANDOM / POSIX_FADV_RANDOM counter-productive
The next surprise looking at the results above, is that posix_fadvise(fd, 0, 0, POSIX_FADV_RANDOM) or its equivalent for memory maps are actually mostly counter-productive. POSIX_FADV_RANDOM is intended to alleviate pressure on the page cache, by hinting to the operating system that file accesses are going to be random and automatic read-ahead is likely pointless.
Perhaps tablebase access patterns when people are analysing endgames are not so random afterall.
Again, this may differ for chess engines, where probes may be more likely to be scattered across different possible endgames.
Table prefixes on limited SSD space
To decide how to use the limited SSD space, let's have a look at the anatomy of a single table probe. The position will be encoded as an integer index, based on encoding information from the table header. Then we need to find the compressed data block that contains the result for the particular index. Syzygy provides a "sparse" block length list, which points close to the correct entry in the block length list, which is then used to find the relevant data block.
| Table section sizes | WDL | DTZ | Total |
|---|---|---|---|
| Headers and sparse block length lists | 38 GiB | 9 GiB | 47 GiB |
| Block length lists | 274 GiB | 64 GiB | 339 GiB |
| Compressed data blocks | 8433 GiB | 8458 GiB | 16891 GiB |
We could certainly use the SSD space for an additional layer of adaptive caching, to cache hot list entries and data blocks. But since we're trying to improve tail latencies in particular, it makes sense to think about the worst case. By putting the sparse block length lists and the block length lists on SSD storage, hot or cold, we can guarantee a maximum of 1 slow disk read per table probe.
In our case that doesn't quite fit when using the SSD space in RAID 1 (mirrored), but since this optimization is optional, we can give up redundancy and use RAID 0.
Parallelizing reads
In chess engines, a typical tablebase request will be for a single WDL value. But for the user interface we instead want to display DTZ values for all moves.
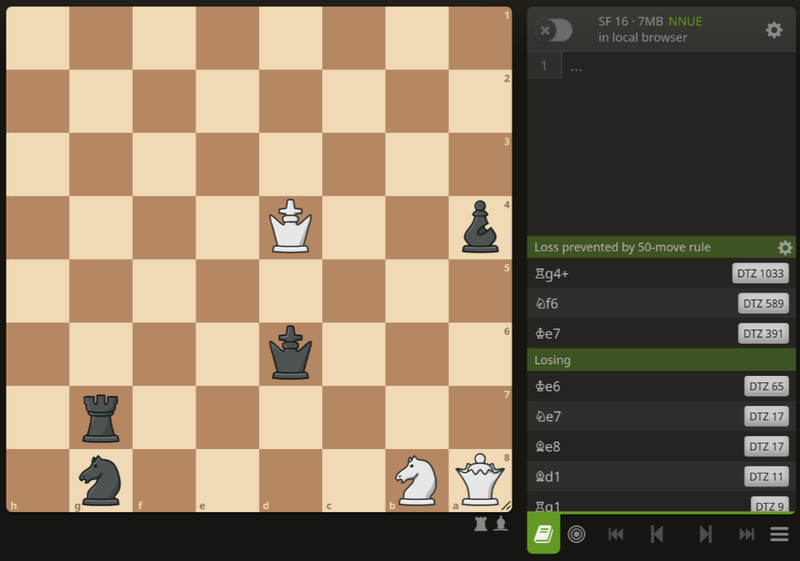
Tablebase explorer
That, together with Syzygy's internal resolution of captures, will cause the average request to issue 23 WDL probes and 70 DTZ probes. In the initial implementation handling of requests was parallelized, but probes within each request were executed sequentially.
In the benchmark results we can see that using more fine grained parallelism has some overhead at the low end, but significantly reduces tail latencies. Of course the disks can not really physically handle that many parallel reads, but now the I/O scheduler is more likely to plan them in a way that will finish each request as soon as possible, and can better plan the order of all involved disk accesses (minimizing time until the disk's read head is at the next requested sector).
Performance in production
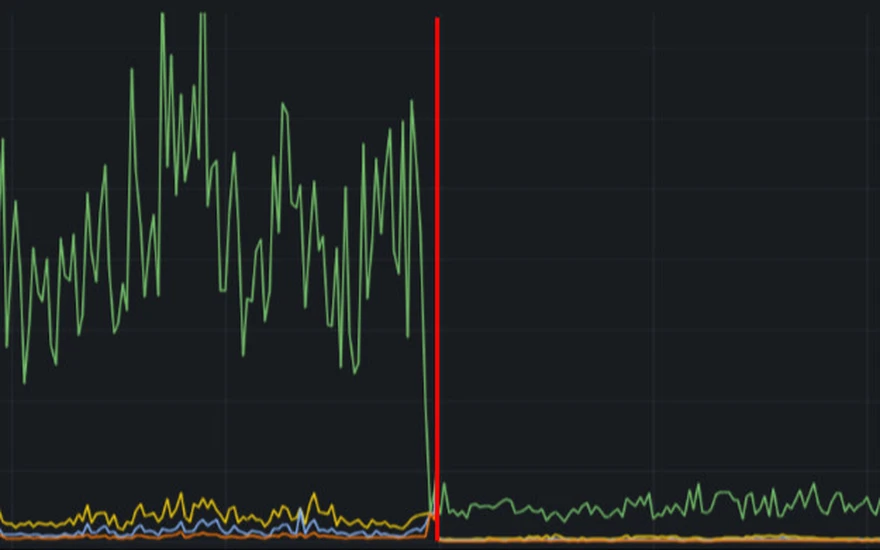
Finally, it's good to confirm that optimizations in the benchmark scenario actually help in production. Here are response time charts sliced together.
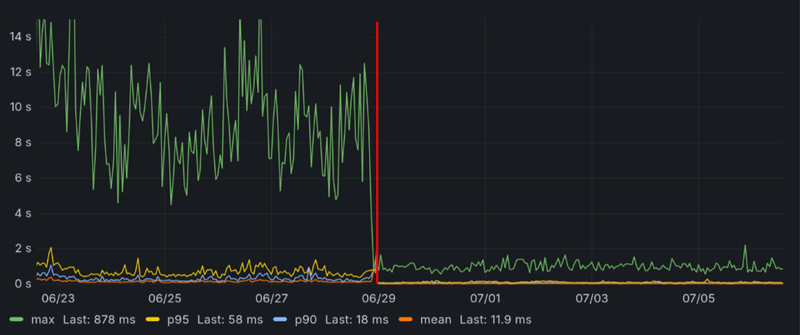
Standard chess response times
Raw data at https://github.com/niklasf/lila-tablebase-bench

